
TMUS.US
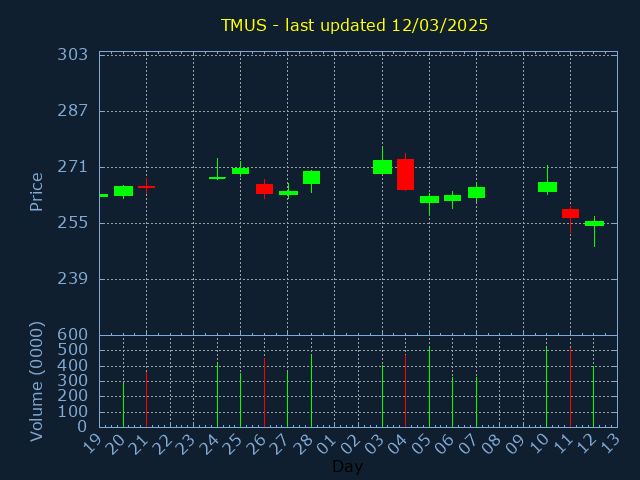
T-Mobile US Inc
SECTOR:
10,180,943 USD traded on 12/03/2025
| Volume | %Daily avg. |
|---|---|
| 3,982,999 | 99% |
| OPEN | HIGH |
|---|---|
| 254.51 | 256.96 |
| 200daySMA | 100daySMA |
|---|---|
| 211.947 | 237.157 |
Close:255.61 |
|
|---|---|
|
Change -1.060 |
%Change -0.41% |
| LOW | CLOSE |
|---|---|
| 248.26 | 255.61 |
| 50daySMA | 20daySMA |
|---|---|
| 244.465 | 276.962 |
| Date | Pattern | Price | Sign | |
|---|---|---|---|---|
| 12/09/24 | TREND | 200.73 | ||
| 17/09/24 | TRIANGLE | 204.45 | ||
| 03/02/25 | DIVIDEND | 1.59% | EXDIV.28/02 |