New to investing?

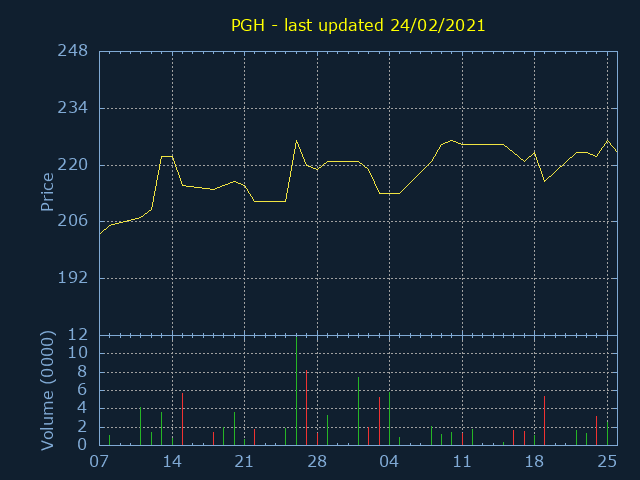
Personal Group Holdings plc (PGH) Ascending triangle.
Trading Range
This algorithm identifies stocks that have traded horizontally within a defined range of at least 9% over the last three months. It lists stock where the price is currently at the bottom of that trading range.
Upward Trendlines
Three months data is displayed. Stocks that show an upward trending channel over the last 6 weeks are listed.
Ascending Triangles
The ascending triangle is a bullish continuation pattern. It is indicative of increased buying pressure. The rising lower trendline provides cheap entry points before the pattern completes and a breakout occurs.
High Volume
Today’s volume is compared to the average daily volume over the last month. This algorithm can highlight the trading activity of large institutional investors days before a TR-1:Notification of major holdings RNS is released.
Breakout
Following a period of consolidation and relatively low trading activity, this algorithm detects an upside breakout and renewed interest in a stock. This algorithm regularly detects breakouts of 50% and more.
Doji
Highlighting indecision, the Doji candlestick pattern often precedes a price reversal. It can be used with the trading range and upward trendline algorithms to time entry and exit points.

