
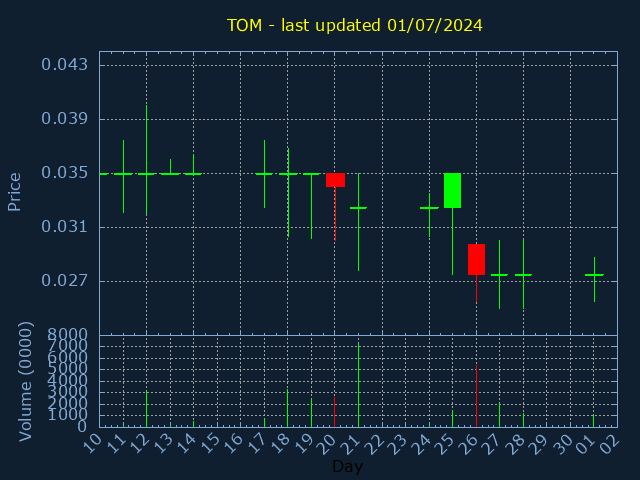
TOM.L
TomCo Energy Plc
SECTOR:Oil & Gas Producers
£2,894 traded on 01/07/2024
| Volume | %Daily avg. |
|---|---|
| 10,524,217 | 66% |
| OPEN | HIGH |
|---|---|
| 0.0275 | 0.0288 |
| 200daySMA | 100daySMA |
|---|---|
| 0.060 | 0.044 |
Close:0.0275 |
|
|---|---|
|
Change 0 |
%Change 0 |
| LOW | CLOSE |
|---|---|
| 0.0255 | 0.0275 |
| 50daySMA | 20daySMA |
|---|---|
| 0.037 | 0.036 |
| Date | Pattern | Price | Sign |
|---|---|---|---|
| 27/11/23 | TREND | 0.075 | |
| 28/11/23 | TREND | 0.075 | |
| 04/01/24 | TREND | 0.0925 | |
| 05/01/24 | TREND | 0.0925 | |
| 08/01/24 | TREND | 0.0925 | |
| 09/01/24 | TREND | 0.0925 | |
| 01/07/24 | 3MONTH_LOW | 0.0275 | |
| 01/07/24 | 1YEAR_LOW | 0.0275 |